
$4.25 Filet Mignon Now Costs $70: Understanding Inflation, Stagflation And Commodities
Over time prices rise due to inflation, however, the pattern is never a straight line. Historical data show inflation tends to erupt in bursts. Credible experts think the next inflationary burst is around the corner.
Historical Look At Inflation
Inflation is an economic term for the general rise in the price of goods over a given time. When prices rise, the purchasing power of a fixed number of dollars decreases. For instance, $100 a decade ago might have bought you 10 widgets. Today, it might only be able to buy seven widgets if the price of a widget increased.
Inflation is caused by the basic economic principle of supply and demand. When the money supply increases, then the value of that money drops over the medium and long-term. Over the long-term, an increase in money supply results in higher prices because more dollars end up chasing the same quantity of goods.
Short-term changes in the money supply may not show up in the economy right away because of a phenomenon known as money velocity, which is basically how fast money changes hands. Sometimes newly-printed money might sit idle in a checking account or under a mattress before it starts circulating in the economy. Eventually, all newly printed money makes its way into the economy over the medium and long-term.
The Roman Denarius
Inflation and monetary devaluation have happened in almost every civilization using a fiat currency (paper and non-precious metal coins) in recorded history. The Roman Empire experienced pronounced devaluation of its currency (the Denarius) because its influence sphere had become too large and it pursued too many expensive military campaigns.
The Roman Denarius was a coin made of silver and other metals. Over time the silver content dropped as the Roman government devalued its currency. Silver is a semi-precious metal similar to gold - both silver and gold are relatively expensive compared to other metals because they are scarce. Gold and silver have been used as a store of value and medium of exchange for more than 5,000 years. A large component of Bitcoin's value proposition is also based upon scarcity. The total number of Bitcoins that can be created is limited to 21 million - in this sense, Bitcoin is scarcer than gold because gold will continue being mined for the foreseeable future.
Roman emperors decreased the Denarius value over time in order to pay the empire's mounting bills. From time to time the Roman mint would collect existing coins in circulation, melt the metal, and then re-issue new coins with a reduced amount of silver in each coin. The Roman Empire was able to increase the quantity of Denarius coins in circulation because it could make more coins with the same amount of silver.
Roman citizens realized that the supply of coins was increasing, while at the same time the silver content was dropping. Prices adjusted higher to account for the greater supply of coins in the market. At the height of the Roman Empire about two cups of normal wine cost roughly one-eighth of a Denarius. After inflation occurred and the quantity of Denarii increased that same amount of wine cost eight Denarii (6,400% inflation).

Source: Visual Capitalist
Takeaway: The silver content in each Denarius coin dropped over time. The Visual Capitalist
is a great source of information - we recommend checking out the site.
At its peak, ancient Rome had a population of about one million people which was very large at the time compared to other cities. Rome's population had gradually dwindled to 30,000 by 537 AD when the Goths sieged the capital. High inflation and persistent state deficits were major reasons why the Roman civilization collapsed. The empire had become bloated and it could no longer afford its bills... so it resorted to using inflation to pay the bills.
Modern Day Inflation - A $4.25 Filet Mignon Steak Now Costs $70
Prices tend to rise over time - this is common wisdom. The issue is that compounding at high rates can make the cumulative changes become very large.
Compound interest is the eighth wonder of the world. He who understands it, earns it ... he who doesn't ... pays it.
- Albert Einstein.
Inflation tends to experience oscillations similar to a pendulum - sometimes it is high, and sometimes it is low. The long-term median rate of inflation is about 2-3% for most developed countries. History shows there are often "bursts" of inflation, where inflation rises above the long-term average for many consecutive years and the economy experiences a great reset.
One famous historical example of very strong persistent inflation resetting the economy is the hyperinflation in the German Weimar Republic after World War I. Although Weimar receives the most attention, it's important to note that broader continental Europe experienced pronounced inflation too. Continental European countries had racked up huge debts to fight WW1 between 1914-1918. After the war they were saddled with debt - most countries resorted to inflating their way out of debt.
Weimar's inflation was especially strong for three reasons: 1.) The debt load was larger due to Treaty of Versailles war reparations, 2.) Germany had lost tax jurisdiction over many industrial areas that generated large amounts of tax revenue, and 3.) persistent state deficits had bloated to more than 30% of GDP at the time (estimated, GDP measurements for the period vary).
High inflationary bursts lead to significant wealth destruction and monetary devaluation due to their compounding nature. If inflation compounds at 15% for five years then prices will double and the purchasing power will drop by 50%. Compound interest can be very powerful. For instance, $100 compounded at 50% for five years earns a profit of $659, not $250 ($50 times five years) - the difference of $409 is compound interest (interest earned on interest).
Annual Inflation Change Since The 1950s
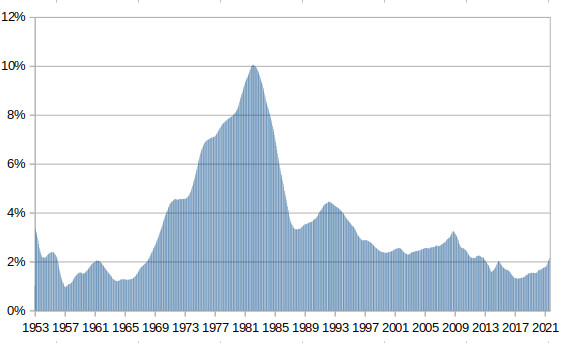
Source: US Bureau of Labor Statistics and Equipment Radar
Takeaway: The chart above shows the annual change in the five-year rolling average consumer price index. Notice how inflation oscillates over time,
and inflation over the past few years is low relative to longer-term time series.
In the inflation chart above showing US BLS data, the price of goods increased about 950% between 1953 and 2021. The median inflation rate was 2.6%, but we experienced a pronounced burst of inflation during the 1970s. Had inflation held flat at 2.6% for the same duration, prices would have only increased about 475%, not 950%. The difference is due to a strong inflationary burst that compounded vigorously.
Other economic data sources, including Shadow Stats, believe actual inflation is above official reported inflation over this same time horizon. There are many different methodologies to calculate consumer price inflation.
While visiting the Banff Springs Hotel, we noticed a historical menu circa the late 1940s / early 1950s. The prices were incredibly low compared to today's prices. For instance, you could have purchased a fine-grade filet mignon for $4.25 Canadian Dollars. Today, that same steak costs $70 Canadian dollars - 15x increase.
Banff Springs Restaurant Dinner Menu Circa The Late 1940s/Early 1950s

Source: Equipment Radar
Note: The menu above is from a restaurant inside the Banff Springs Hotel,
circa the late 1940s/early 1950s. The hotel opened in 1888 and is about one hour outside of Calgary, Alberta, Canada
(we highly recommend visiting the historic hotel, Banff and the Canadian Rockies - all are excellent).
Takeaway: The filet mignon cost $4.25 Canadian dollars (see arrow),
which was about $4 US dollars at the time.
Banff Springs Restaurant Dinner Menu Today

Source: 1888Chophouse.com Online Menu at Banff Springs Hotel.
Takeaway: The Banff Springs steakhouse charges $70 Canadian dollars (about $56 US dollars) for a similar filet mignon today. This represents
an increase of about 15x.
Banff Springs Hotel

Source: Wikipedia.
Note: Canadian Pacific Railway opened the hotel in 1888. It is a magnificent architectural landmark surrounded by the pristine Canadian Rockies landscape.
Food Inflation Is Tame If You Exclude Items That Have Risen
Earlier this month the White House's National Economic Council Director Brian Deese addressed higher food costs by saying that food inflation is tame if you make several adjustments.
About half of the overall increase in grocery prices can be attributed to a significant increase in prices in three products: in beef, in pork, and in poultry. And in beef and in pork, we’ve seen double-digit increases in prices over the last couple of months... If you take out those three categories, we’ve actually seen price increases that are more in line with historical norms.
- White House's National Economic Council Director Brian Deese
The United Nations monitors global food prices in its monthly FAO Food Price Index. The price index tracks a large basket of common foods including meat, sugar, cereals, dairy and vegetable oils. Over the past year, food prices have risen about 33% globally. Also, the UN's data seem to contradict Director Reese's statement - meat has increased the least out of all food groups in the index.

Source: UN FAO.
Takeaway: Food prices are rising at the fastest rate in several years. Meat (light blue line) increased
the least compared to other food items.
Even if Director Reese's statement is true, it's not realistic at all. About 95% of the population in the United States eats meat. Beef, pork and poultry are core dietary components for the majority of the population.
In the United States, the average household expenditure for food is about $8,000 per year. In 2020 the overall expense dropped because many households shifted food purchases from dining out to dining in (likely a temporary trend due to restrictions). Food expenditures represent about 10% of household income, which is reasonable. Food can be closer to 35-50% of household income in many developing countries where the average income is lower. Higher food costs have a real impact on developing countries and geopolitical stability.
Higher Commodity Prices Are Driven By Supply And Demand
The global economy is interconnected - changes in one country or industry have ripple-through impacts on other countries and industries. Higher food costs are often a result of higher input costs. For instance, beef prices tend to rise when feed costs (corn, hay, etc) rise. Vegetable oil prices increase when canola prices increase. Corn prices increase when fertilizer and machinery costs increase. Machinery costs increase when steel prices increase. The pattern goes on and on.
The price of commodities usually follows the basic economic principle of supply and demand.
| Supply | Demand | Prices |
| ↑ Higher | ↔ Flat | ↓ Lower |
| ↔ Flat | ↑ Higher | ↑ Higher |
| ↓ Lower | ↔ Flat | ↑ Higher |
| ↔ Flat | ↓ Lower | ↓ Lower |
Over the past few years, the global supply of many commodities dropped (see related article on commodities). Supply took a further hit when many businesses (including commodity producers such as miners, chemical companies, farmers, etc) reduced output due to general business uncertainty and restrictions.
Demand increased rapidly through the second half of 2020 and into 2021 due to fiscal stimulus distributed to consumers and businesses. Supply chain shortages (such as semiconductors) are limiting production in many industries including farm and construction equipment, heavy-duty trucks, and cars and pickup trucks. The combination of reduced supply and higher demand has resulted in higher prices for many goods.
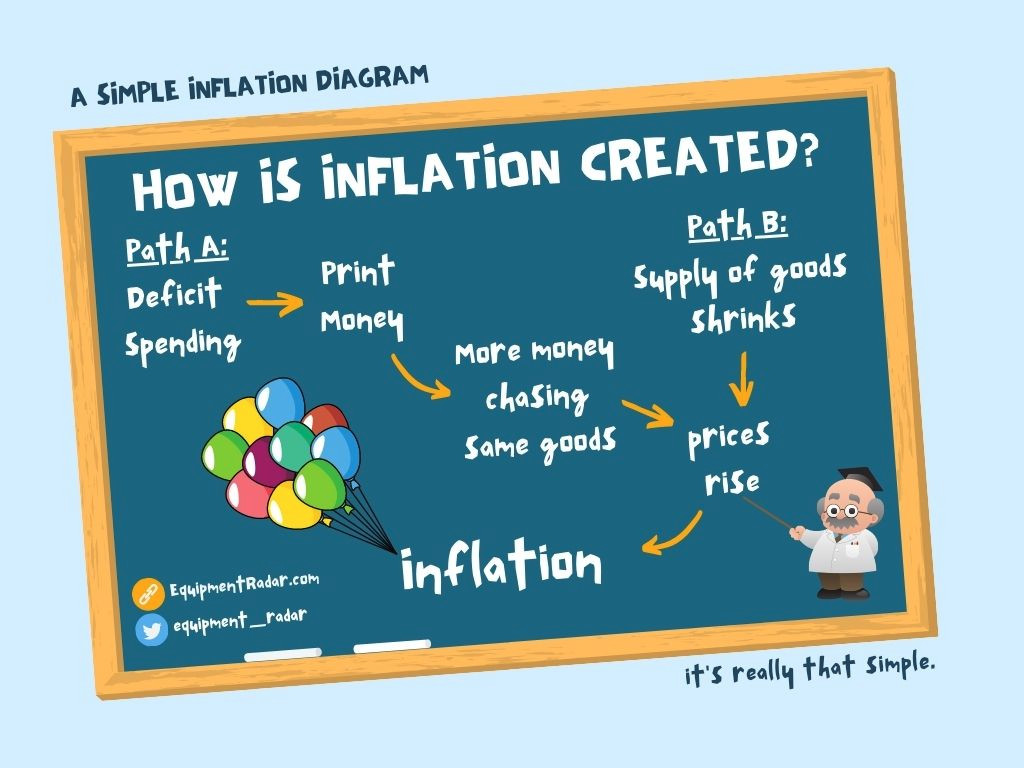
Note: Many professional economists today argue about how inflation is created. There is no commonly agreed-upon answer (our infographic above is one attempt at an explanation in a concise display). There are many intricacies to consider, and it is easy to get lost and not see the forest from the trees. Money is similar to most other goods and services in the sense that it follows the basic economic principle of supply and demand. All else equal, a higher money supply reduces money's scarcity and value.
Money Supply Increased Meaningfully
Global governments responded to the pandemic by increasing fiscal stimulus - in the United States, this included checks handed out directly to citizens ("stimmy" checks) and businesses (forgiven PPP loans). This stimulus is different from prior monetary stimulus because it represents cash handed out directly to households and businesses to spend immediately. This stimulus cash hits the economy much faster than prior "bond-buying" stimulus which stayed dormant in financial markets.
Money supply in the US economy (see M3 data reported by Federal Reserve) is up a whopping 33% since December 2019. Money supply increased to $20,388,900,000,000, up about $5,000,000,000,000 since the end of 2019 (no trillions label is intentional to emphasize the gigantic number). To put this in perspective, the $5 trillion increase in money supply is larger than the total amount of tax revenue the US Government collected in 2020 ($3.6 trillion), and it is about 25% of US GDP.
Money supply growth at these very high levels is like a sugar high after eating candy. The newly printed money hits the economy and demand increases because consumers and businesses have new cash to spend - the experience is strong and intense, but it is short-lived. Soon, the economy will experience a pullback as the sugar high wears off. The only way to keep it going is by eating more sugar... but there is a limit to how much sugar the economy can consume before it becomes very unhealthy and sick (high inflation). Soon, the fiscal stimulus that entered our economy will wear off, and we will need a new sugar injection (further increase in the money supply) to keep economic activity elevated.
Policymakers have a tough choice. They can avoid inflation by not printing more money, but that will cause a very strong pullback. If they continue printing money it will cause high inflation and increase the risks of hyperinflation (runaway inflation). Ultimately, they will likely choose inflation because it keeps economic output elevated and avoids a broader deep economic contraction and widespread bankruptcies (deflationary spiral).
US Money Supply (M3)

Source: Federal Reserve
Takeaway: Money supply has increased rapidly as a result of large fiscal stimulus and deficit spending.
Stagflation Could Occur
Another situation that could occur soon is economic stagnation in combination with higher inflation. This term is called "stagflation" by economists. The late 1970s experienced stagflation due to excessive monetary policy (similar to what we see today). Stagflation typically occurs after the money supply has expanded, but it's not enough to keep the economy at full output - so the economy naturally contracts and the new money causes prices to rise.
It's important to note that inflation (higher money supply) increases nominal GDP, however, that does not mean that living standards also have risen. For example, if your income doubles and your cost of living also doubles, then you are probably not much better off with a higher income. Living standards improve when GDP rises more than inflation (typically driven by productivity). Heavy equipment including construction and farm equipment and heavy-duty trucks help improve economic productivity.

Source: US BEA
Note: Recessions are highlighted in gray.
Takeaway: Long-term the US GDP has grown in nominal terms despite recessions every so often.
Equipment Demand Will Likely Remain Strong
Commodity prices increase during stagflationary and inflationary times. Higher commodity prices in turn tend to help support commodity-related industries such as agriculture, mining, forestry, aggregates and more. Commodity-related industries tend to fare better on a relative basis than non-commodity industries. As a result, demand for machinery and capital investments in equipment tend to remain elevated while the rest of the economy contracts.
If we do experience another inflationary or stagflationary future, equipment dealers and manufacturers including Caterpillar, Case, New Holland, Komatsu, John Deere, JLG, Genie, Potain, etc should continue to experience demand better than the broader economy as prices for resources and commodities rise.
Ahead There's Probably No Other Choice Than Higher Inflation
Under normal circumstances assuming that an economy is balanced and has modest debt levels, it can withstand moderate economic recessions. The ability to tolerate recessions changes when an economy has an excessive amount of debt - the reason for this is because debt holders have a much more difficult time repaying the debt when the economy contracts.
A deep contraction can trigger bankruptcies and liquidations, which has the potential to turn into a deflationary spiral similar to what the economy experienced during the Great Depression. After several tough deflationary years during the Great Depression, policymakers opted to devalue the currency and increase fiscal stimulus to reignite economic growth.
It does seem highly unlikely that the USA will default on its government debt. Any government that can print its own currency and also borrow in its own currency (ie USA, Japan, China, etc) can simply print more money to repay its debt obligations. The printing is not a free lunch - printing more money ends up creating inflation.
Since the 1960s, debt-to-GDP has risen for the United States and most other countries. Debt has grown at a faster rate than GDP for about 60 years - long-term this is unsustainable. Whatever is not sustainable eventually ends - the question is... when will it end?
The recognition that things that are not sustainable will eventually come to an end does not give us much of a guide to whether the transition will be calm or exciting.
- Tim Geithner, Secretary of the Treasury during the Financial Crisis
Global debt data collected by the Bank of International Settlements show that global debt-to-GDP has grown considerably for most of the world. The US Government Accountability Office (GAO) 2020 government financial statements and projections forecast deficits and debt-to-GDP expanding to unprecedented levels through 2050.
Historically, debt-to-GDP would rise after wars and then return to low levels as the country paid back the debt and GDP grew (GDP grew faster than debt). The rise in debt-to-GDP over the past 15 years has been driven by fiscal spending to prevent a deep recession. Pumping the system full of stimulus cash and raising debt-to-GDP works for only so long before it no longer works. Debt cannot grow faster than GDP in perpetuity. At some point the system breaks, and we could reach that point in the near future.
When looking at debt, it's important to look at the system-wide debt that includes government, corporates (businesses) and households. Most governments can control the issuance of their currencies, but households and businesses cannot - as a result, the fates of indebted households and businesses are at the mercy of policymakers. Usually, policymakers are required to step in and bail out over-indebted households and businesses (similar to bailouts during the Financial Crisis and China's Evergrande at the moment).

Takeaway: The US government's budget office forecasts that debt-to-GDP will rise dramatically. It is important to note that projections do not assume a moderate or severe recession (which would further increase debt levels). Interest expense paid on the national debt will grow meaningfully going forward.

Note: The entire world has elevated debt levels. We are all in the same boat. As you can see, Japan's system-wide (government, corporates and households) debt is above 400%. It's possible this gravy train has more room to run before it hits a wall... time will tell. In the USA system-wide debt-to-GDP increased from 129% in 1960 to 293% today.
Inflation Experts To Follow
Dr. Michael Burry, Scion Asset Management
Michael Burry, founder of Scion Asset Management and @michaeljburry on Twitter, is a famous investor who anticipated the Great Financial Crisis of 2006-08. Earlier this year he said that people should "prepare for inflation". He has cited several data sources similar to those above and noted that history has many examples of inflationary resets. He believes that the US is destined for strong inflation or even hyperinflation similar to the German Weimar Republic.
People say I didn't warn last time. I did, but no one listened. So I warn this time. And still, no one listens. But I will have proof I warned.
- Dr. Michael Burry
Burry is a thoughtful person who takes his time to research and understand issues before making a public forecast.
Michael Ashton, Enduring Investments
Bloomberg recently featured an article on inflation featuring Michael Ashton, founder of Enduring Investments and @inflation_guy on Twitter. In the article, Ashton notes how his views on inflation were not appreciated by the mainstream for many years after he founded his advisory firm in 2009. Ashton said that more recently people have started to pay attention and are asking for his advice. The large influx of money supply and the recent rise in inflation has reminded many that inflation is a factor that will always be present as long as we have an expanding money supply.
The lack of interest [in inflation] was amazing. It’s incredible how little people thought about it — what that risk was.
- Michael Ashton
Peter Schiff, SchiffGold
Peter Schiff, founder of SchiffGold and @PeterSchiff on Twitter, hosts a regular podcast discussing monetary policy and the economy. A long-time gold bull, Peter's clients experienced outsized investment gains in 2020 as the money supply increased. Peter is a student of history and has studied long-term debt cycles.
Maybe someone should inform #Powell that prices are not rising by a mere 2/10 of a percent above the Fed's 2% target. They're rising at triple that rate in 2021, and will likely quadruple that rate or more in 2022. This is not the type of #inflation families can just shrug off!
- Peter Schiff